This page provides information to help mappers create their maps.
Orienteering maps are built to one of four mapping specifications.
These specifications are living documents with regular updates. The latest version of the mapping specifications can be found here.
A history of the development of the mapping specifications can be found here.
The O-Map Wiki site provides many examples of correct and incorrect use of the orienteering mapping symbols.
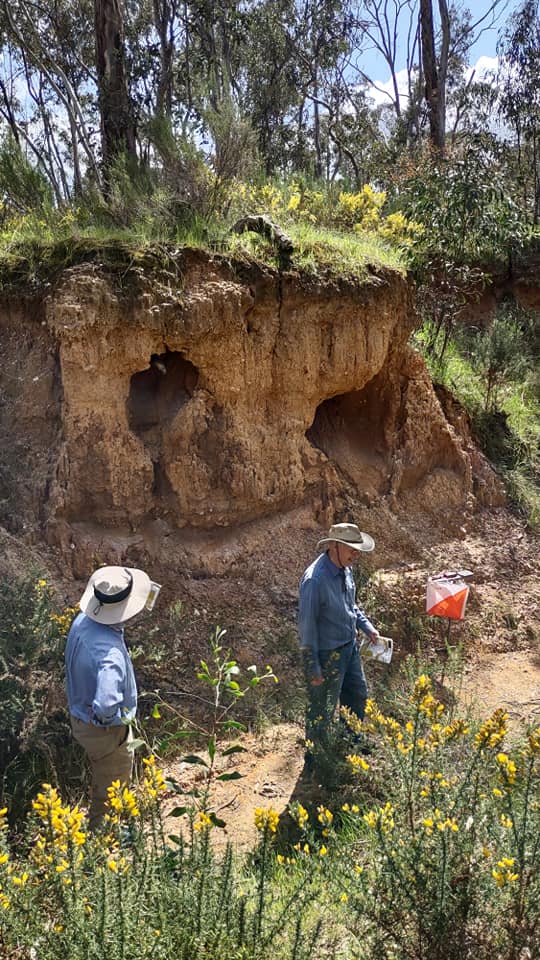
Here is an Australian guide to the mapping of granite landscapes. One day a similar guide for gold mining terrain may appear. At some point a similar document for gold mining terrain may appear.
Today most mappers use software to create basemaps, undertake fieldwork and do final drafting of the map. There are two main choices for the mapper:
As always there are good reasons to choose one or the other of these applications, and also good reasons choose the other. Rather than be forced into a choice, many mappers use both applications in their mapping work-flow. The choice is yours.
OCAD is the application with the longest history. Australian orienteers started using OCAD at about version 4 or 5 around the turn of the millennium. The software is now up to version 18 (having skipped 12 to 18 along the way). The application was copy protected at version 9 and changed charging policy to an annual license fee with version 18. At the time of writing the annual fee for the orienteering mapping version of the software is around A$270. This fluctuates with exchange rates as the price is denominated in Swiss Francs. Advantages of OCAD include:
Reasons why a mapper might choose not to use OCAD:
Introductory OCAD instructions.
Open Orienteering Mapper is an open-source project first released by Thomas Schöps in 2012. The project underwent a period of rapid collaborative development to quickly acquire all the basic functionality needed to make an orienteering map. Reasons to choose Open Orienteering Mapper include:
Reasons why a mapper may choose not to use Open Orienteering Mapper:
Lacking advanced features such as compliance testing, lidar processing.
LAStools is a suite of programs designed for the rapid processing of lidar data. The software is functional on Windows and Linux. It is free for non-commercial use, but with a point limit of 1,500,000. Above this point limit random noise is introduced. Orienteering mappers use this software for splitting and merging files and for reclassifying ground points. There is lots of additional functionality that most mappers have not yet explored.
OL Laser is a lidar processing application developed by Jerker Boman, a Swedish orienteer. The latest version is in Swedish. You can edit the config file to see English or install an earlier version (1.4.0.3). This application will provide contours, slope, relief, and vegetation outputs.
Kartapullautin (Map making machine) is a Windows application that processes lidar to produce a basemap including contours, vegetation and cliffs. The software has some advantages over other contour generating applications in some terrains.
The Relief Visualisation Toolkit is a suite of tools favoured by archeologists. One visualization of use to orienteers is the Sky View Factor which highlights mounds, rocks, and pits – if the ground layer has been classified for orienteering purposes.
Every map needs to be congruent with a reference system. This will generally be a Universal Transverse Mercator (UTM) projection. There are three easy methods of starting the map with this sorted.
Every mapper would like to start the mapping task with a high-quality base map. A high-quality base map will mean less time spent in the field and a more accurate final map.
A short explanation of lidar technology is here.
Lidar data was first used for orienteering mapping in Australia as part of the 2012 Easter carnival in Bendigo (The maps La Trobe Bendigo, Yorkshire Hill, and Crusoe).
ELVIS: The ELVIS (ELeVation Information System) web site hosted by GeoScience Australia is a portal that is increasingly being used by various jurisdictions to store lidar data. The site seems to have complete coverage of NSW, near full coverage of Tasmania, sparse patchy coverage of Victoria and Queensland and coastal and river coverage for South Australia. West Australia misses out. The lidar quality is variable, ranging from high density in more recent uploads to low density (1 point per metre) in parts of Tasmania. If there is no lidar on the site for your area, there may be some DEM data, though this is often very coarse.
Grey lidar data: Not all publicly held lidar data has been loaded onto the ELVIS site. The extent of grey data varies between states and access will vary according to the state. Approach your state Mapping Coordinator for further details.
Commissioning lidar: Failing these sources, your organization may decide to commission a lidar flight.
A guide to commissioning lidar by Noel Schoknecht.
Each state has a cadastral boundary web site.
Some of these sites also provide aerial photography. There are commercial providers of high resolution imagery. Basic georeferenced imagery can be downloaded from Google Maps using OCAD.
Lidar data is generally used to produce contours, slope and terrain images and a vegetation map.
Today there are two main and one uncommon approach to the creation of a base map using lidar data.
It’s not uncommon to mix and match the three options. Below are some links to useful instructional resources.
Clearly there are multiple approaches to base map generation using lidar data. The nature of the terrain will influence the choice of tools. Here are some examples reported by Australian mappers:
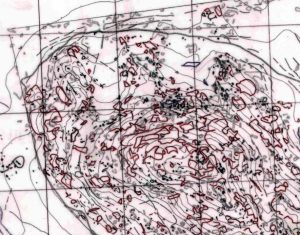
Analog photogrammetry such as this was once the gold standard for orienteering base maps.

The analog photogrammetry machines are now museum pieces. The transparency film used to create the photographs required for these machines has not been manufactured for some years. It is highly unlikely any orienteer will be using base maps such as these today. However, some mappers may find themselves updating older maps without supporting lidar data. In this case, they are still working with photogrammetric contours that have been field worked without GPS assistance.
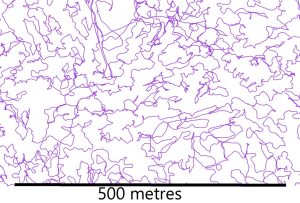
A comparison of photogrammetrically derived contours and quality lidar contours is shown below. The purple lines are 2.5 metre lidar contours. The brown are the old 5 metre contours derived from analog photogrammetry. The two highlighted areas demonstrate geographic misplacement and what may be errors in the old data. Elsewhere a discerning eye can detect areas where the old contour lines exaggerate the features, and areas where they diminish the features shown on lidar.

Improving these contours, even with GPS assistance, will often be labour intensive and require an approach described in the section on use of coarse DEM data. If you can access lidar data, it will be easier to map again from the lidar base rather than adjust the old map. If you cannot access lidar data, and attempt to update the map using GPS assistance, there will be areas where contours will need to be significantly reworked.
In Victoria there is full state coverage with a 10 metre DEM. The OCAD DEM Import wizard can create contours based upon this data. The resulting contours are very broad with no fine detail. That detail needs to be created by the mapper. A GPS enabled tablet is invaluable in this task. In some landscapes the contours will only need adjusting by eye. In more complex contour landscapes, the mapper may need to walk the line of selected levels and use the GPS trace on the table to create a more accurate draft contour. Finally, this draft will need to be adjusted by eye to represent what the orienteer will perceive whilst running.
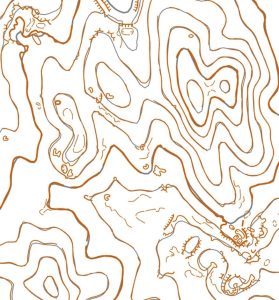
The comparison of DEM and final contours is shown in two examples below. In the first example, there is significant difference between the two, indicating the extent of extra work dictated using a poor base map. In the second example there is less variation, indicating either the terrain is of poor quality, or it has many point features not shown in this base map.

High variance between DEM and final contours

Low variance between DEM and final contours
Field work is the systematic traversing of the terrain to identify and locate every feature which must be mapped and to ignore those features which should not be mapped. These choices are constrained by the mapping specification.
Field work is a time-consuming experience. An example of the time to field work and draft different terrains by one mapper is shown in the table below.
Terrain example | Hours per kilometer | Distance walked per square kilometer |
Granite terrain 1 poor base | 49 | 86 |
Granite terrain 2 poor base | 68 | 104 |
Granite terrain 3 poor base | 58 | 60 |
Reef and gully spur 1 with good base | 11 | 24 |
Gully Spur with good base | 6 | 16 |
Mixed gully-spur, mining and granite with poor base | 58 | 63 |
Mining and gully spur good base | 19 | 25 |
Reef and gully spur good base | 11 | 20 |
Gully and reef good base | 11 | 19 |
Time required is dependent upon terrain complexity, the technology used and the quality of the base map. A good base map reduces the distance walked. A GPS reduces the distance walked.

There are currently a number of technological approaches to field work:
Mappers follow different workflows. Some try and produce their final map on tablet in the field. Most will redraft a final version at the desktop.
Whichever method is used, it is advisable to undertake some form of compliance testing to gauge the extent of compliance with the ISOM17 specification. ISOM17 and ISSprOM19 define not only the symbol definitions which should not be changed without very good reason, but also define minimum size of line and area features and minimum gaps between symbols. Every mapper should make an attempt to draft at least one fully compliant map. Choose a small map. This will be a very good learning experience and may change the way you map your terrain.
The following guides were written before the introduction of the latest specification for sprint mapping and the widespread adoption of tablet technology.
